7.7. Better Outputs#
7.7.1. How to Strip Outputs and Execute Interactive Code in a Python Script#
Show code cell content
!pip install strip-interactive
Have you ever seen a tutorial with an interactive Python code and wished to execute it in a Python script like above?
It might be time-consuming to delete all >>> symbols and remove all outputs, especially when the code is long. That is why I created strip-interactive.
from strip_interactive import run_interactive

code = """
>>> import numpy as np
>>> print(np.array([1,2,3]))
[1 2 3]
>>> print(np.array([4,5,6]))
[4 5 6]
"""

clean_code = run_interactive(code)
[1 2 3]
[4 5 6]
7.7.2. Pyfiglet: Make Large and Unique Letters Out of Ordinary Text in Python#
Show code cell content
!pip install pyfiglet
If you want to make large and unique letters out of ordinary text using Python, try pyfiglet. Below are some outputs of pyfiglet:
import pyfiglet
from termcolor import colored, cprint

out = pyfiglet.figlet_format("Hello")
print(out)
 _   _      _ _
| | | | ___| | | ___
| |_| |/ _ \ | |/ _ \
|  _  |  __/ | | (_) |
|_| |_|\___|_|_|\___/
out = pyfiglet.figlet_format("Hello", font='slant')
print(out)
    __  __     ____
   / / / /__  / / /___
  / /_/ / _ \/ / / __ \
 / __  /  __/ / / /_/ /
/_/ /_/\___/_/_/\____/
cprint(pyfiglet.figlet_format('Hello', font='bell'), 'blue')
 __  __         .    .
 |   |    ___   |    |     __.
 |___|  .'   `  |    |   .'   \
 |   |  |----'  |    |   |    |
 /   /  `.___, /\__ /\__  `._.'
This could be used as the welcome message for your Python package 🙂
7.7.3. Python Fire: Generate a CLI for Any Python Objects in Two Lines of Code#
Show code cell content
!pip install fire
Have you ever wanted to adjust the values of Python objects from the command line, but found it inconvenient to do so? With Python Fire, you can easily generate a command-line interface for any Python object in just two lines of code.
To see how Python Fire works, let’s look at an example. Start with creating file named fire_example.py:
%%writefile fire_example.py
import fire


def get_mean(numbers: list):
    return sum(numbers) / len(numbers)


def get_modulo(num1: int, num2: int):
    return num1 % num2


if __name__ == "__main__":
    fire.Fire()
Writing fire_example.py
Then run the following command on your terminal:
$ python fire_example.py get_mean "[1, 2, 3]"
2.0
$ python fire_example.py get_modulo --num1=3 --num2=2
1
7.7.4. Typer: Build a Command-Line Interface in a Few Lines of Code#
Show code cell content
!pip install typer
While Python Fire is easy to use, it doesn’t provide much flexibility in terms of customization. Typer offers tools for building CLI applications in Python with a more explicit syntax. Typer also uses type annotations to validate user input.
To see how Typer works, let’s look at an example. Start with creating file named typer_example.py:
%%writefile typer_example.py
import typer

app = typer.Typer()

@app.command()
def add_numbers(x: float, y: float):
    """Adds two numbers and prints the result."""
    result = x + y
    print(f"The sum of {x} and {y} is {result}.")

if __name__ == "__main__":
    app()
Writing typer_example.py
Then run the following command on your terminal:
$ python typer_example.py hello world
And you should see an output like below:
Show code cell source
!python typer_example.py hello world
Usage: typer_example.py [OPTIONS] X Y
Try 'typer_example.py --help' for help.

Error: Invalid value for 'X': 'hello' is not a valid float.
You can see that when the input is not a valid float, Typer raised a TypeError with a helpful error message.
Providing the valid inputs will give the following output:
$ python typer_example.py 3 2
The sum of 3.0 and 2.0 is 5.0.
7.7.5. Generate a Tree View with rich#
Show code cell content
!pip install rich
If you want to generate a tree view of a specific structure such as files in a directory, use rich.tree. rich also allows you to add color to each branch using brackets.
from rich.tree import Tree
from rich import print

tree = Tree("[cyan]My Project")
tree.add("[green]data")
tree.add("[blue]model")
src = tree.add("[red]src")
src.add("[red]process_data.py")
print(tree)
My Project
├── data
├── model
└── src
    └── process_data.py
7.7.6. latexify_py: Generates a LaTex Math Description From a Python Function#
Show code cell content
!pip install latexify-py
Have you ever wanted to add math description for your Python function but found it time-consuming to do so? latexify_py allows you to add LaTex math description with only one decorator.
import math
import latexify

@latexify.with_latex
def solve(a, b, c):
    return (-b + math.sqrt(b**2 - 4*a*c)) / (2*a)

solve
@latexify.with_latex
def sinc(x):
    if x == 0:
        return 1
    else:
        return math.sin(x) / x

sinc
7.7.7. From Python to Paper: Visualizing Calculations with Handcalcs#
Show code cell content
!pip install handcalcs
Python calculations often lack transparency when only showing final results.
Handcalcs addresses this by generating LaTeX output that mimics handwritten calculations. It displays symbolic formulas, numeric substitutions, and results, providing a clear step-by-step breakdown.
This approach makes calculations more intuitive, readable, and easier to verify manually.
Handcalcs can be used in two main ways:
As a cell magic in Jupyter notebooks using
%%render:
import handcalcs.render
from handcalcs.decorator import handcalc
%%render
a = 2
b = 3
c = 2*a + b/3
As a decorator for functions:
from math import sqrt

@handcalc(jupyter_display=True)
def my_calc(x: float, y: float, z: float):
    a = 2*x
    b = 3*a/z + sqrt(a+y/2)
    c = a + b
    return c
result = my_calc(2.3, 3.2, 1.2)
result
18.589979919597745
7.7.8. ManimML: Create Animations of Common ML Concepts in Python#
If you want to create animations and visualizations for common ML concepts in Python, try ManimML.
The GIF below is the visualization of Variational Autoencoder made by ManimML.

ManimML is built on top of Manim.
7.7.9. Great Tables: Create Scientific-Looking Tables in Python#
Show code cell content
!pip install great_tables
If you want to create visually appealing and scientific-looking tables in Python, use Great Tables. With Great Tables, you can customize your table by mixing and matching various elements such as headers, footers, and cell value formats.
from great_tables import GT, md
from great_tables.data import islands

islands_mini = islands.head(10).sort_values(by="size", ascending=False) # pandas DataFrame

(
    GT(islands_mini, rowname_col="name")
    .tab_header(
        title="Large Landmasses of the World",
        subtitle="The top ten largest are presented",
    )
    .tab_source_note(
        source_note="Source: The World Almanac and Book of Facts, 1975, page 406."
    )
    .tab_source_note(
        source_note=md(
            "Reference: McNeil, D. R. (1977) *Interactive Data Analysis*. Wiley."
        )
    )
    .tab_stubhead(label="landmass")
    .fmt_number(columns="size", sep_mark=",", decimals=0)
)
| Large Landmasses of the World | |
|---|---|
| The top ten largest are presented | |
| landmass | size |
| Asia | 16,988 |
| Africa | 11,506 |
| Antarctica | 5,500 |
| Australia | 2,968 |
| Borneo | 280 |
| Baffin | 184 |
| Britain | 84 |
| Celebes | 73 |
| Banks | 23 |
| Axel Heiberg | 16 |
| Source: The World Almanac and Book of Facts, 1975, page 406. | |
| Reference: McNeil, D. R. (1977) Interactive Data Analysis. Wiley. | |
7.7.10. Camelot: PDF Table Extraction for Humans#
Show code cell content
!pip install "camelot-py[base]" "opencv-python" "pypdf2<3"
With Camelot, you can extract tables from PDFs using Python and convert the data into a more structured format, such as a pandas DataFrame or a CSV file for efficient analysis, manipulation, and integration.
To see how Camelot works, start by reading the PDF file named ‘foo.pdf’ and extracts all the tables present in the file.
import camelot
tables = camelot.read_pdf('foo.pdf')
tables
<TableList n=1>
The output shows that there is one table extracted from the PDF file.
Export the extracted tables to a CSV file named ‘foo.csv’. Camelot also supports exporting tables to other formats like JSON, Excel, HTML, Markdown, and SQLite databases.
tables[0].parsing_report
{
    'accuracy': 99.02,
    'whitespace': 12.24,
    'order': 1,
    'page': 1
}
tables[0].to_csv('foo.csv') # to_json, to_excel, to_html, to_markdown, to_sqlite
tables[0].df # get a pandas DataFrame!
| 0 | 1 | 2 | 3 | 4 | 5 | 6 | |
|---|---|---|---|---|---|---|---|
| 0 | Cycle \nName | KI \n(1/km) | Distance \n(mi) | Percent Fuel Savings | |||
| 1 | Improved \nSpeed | Decreased \nAccel | Eliminate \nStops | Decreased \nIdle | |||
| 2 | 2012_2 | 3.30 | 1.3 | 5.9% | 9.5% | 29.2% | 17.4% |
| 3 | 2145_1 | 0.68 | 11.2 | 2.4% | 0.1% | 9.5% | 2.7% |
| 4 | 4234_1 | 0.59 | 58.7 | 8.5% | 1.3% | 8.5% | 3.3% |
| 5 | 2032_2 | 0.17 | 57.8 | 21.7% | 0.3% | 2.7% | 1.2% |
| 6 | 4171_1 | 0.07 | 173.9 | 58.1% | 1.6% | 2.1% | 0.5% |
!pip install pdf2image transformers txtmarker
## Install pdf2image - embeds pdf as image in notebook
# !apt-get update
# !apt-get install poppler-utils
!brew install poppler
To highlight text in PDFs using Python, use txtmarker. Here is an example of how to use it:
from txtmarker.factory import Factory
from pdf2image import convert_from_path
from IPython.display import display

highlighter = Factory.create("pdf")
highlighter.highlight(
    "The Fascinating World of Penguins.pdf",
    "output.pdf",
    [("Walking challenge", "Penguins have to deal with flippers instead of feet")],
)

images = convert_from_path("output.pdf", size=(800, None), single_file=True)
display(images[0])
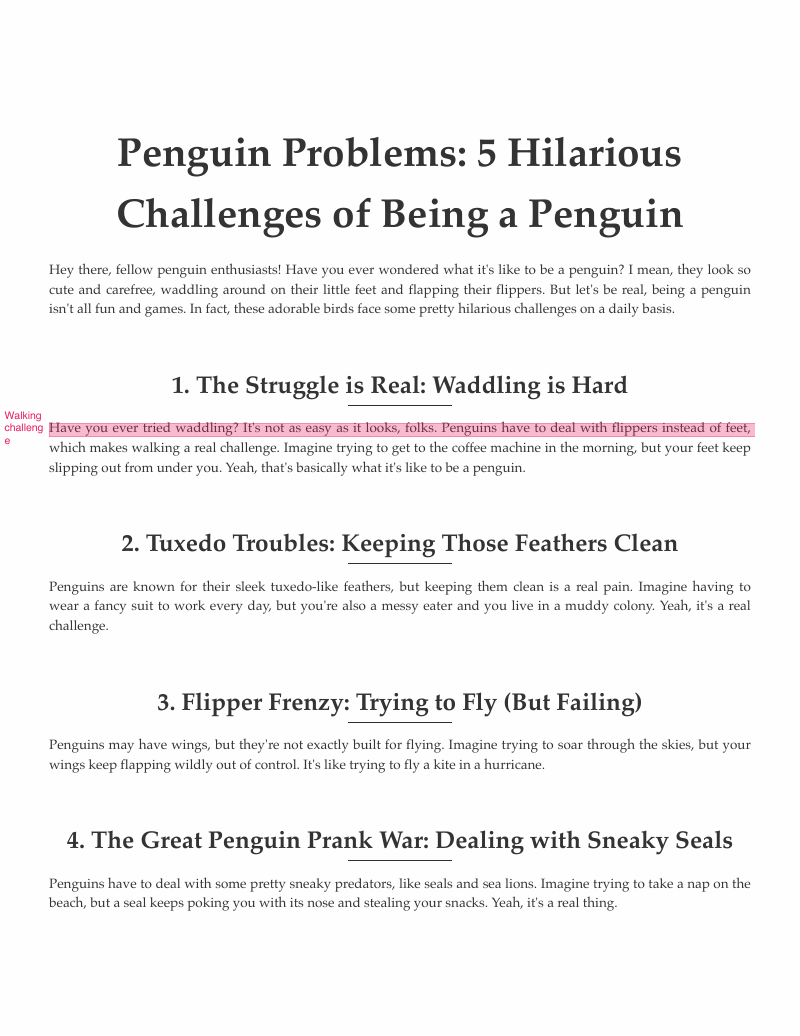
This code highlights the text “Penguins have to deal with flippers instead of feet” in the PDF file “The Fascinating World of Penguins.pdf” and save the output to a new PDF file called “output.pdf”.
But what if you want to highlight text in a PDF based on a question? You can use extractive QA to achieve this. Here is an example of how to use it:
import re

from pdf2image import convert_from_path
from pdfminer.high_level import extract_text
from transformers import pipeline

from IPython.display import display

from txtmarker.factory import Factory

# Create pipeline
nlp = pipeline("question-answering")

# Create highlighter
highlighter = Factory.create("pdf")

## Extracts text from pdf
def extract(path):
  text = extract_text(path)

  # Clean data
  text = re.sub(r"\n+", " ", text)
  return re.sub(r"[^\x20-\x7F]+", "", text)

## Renders first page of pdf file as image
def highlight(path, highlights):
  # Get PDF text
  context = extract(path)

  # Run extractive qa
  highlights = [(name, qa(context, question)) for name, question in highlights]

  # Create annotated file
  highlighter.highlight(path, "out.pdf", highlights)

  # Render pdf as image
  images = convert_from_path("out.pdf", size=(800, None), single_file=True)
  display(images[0])

## Runs extractive qa
def qa(context, question):
  return nlp(context=context, question=question)["answer"]
No model was supplied, defaulted to distilbert-base-cased-distilled-squad and revision 626af31 (https://huggingface.co/distilbert-base-cased-distilled-squad).
Using a pipeline without specifying a model name and revision in production is not recommended.
/Users/khuyentran/book/venv/lib/python3.11/site-packages/huggingface_hub/file_download.py:797: FutureWarning: `resume_download` is deprecated and will be removed in version 1.0.0. Downloads always resume when possible. If you want to force a new download, use `force_download=True`.
  warnings.warn(
highlight("The Fascinating World of Penguins.pdf", [
  ("Walking problem", "What is the main challenge penguins face when trying to walk?"),
  ("Known for", "What is penguin known for?"),
  ("Flying problem", "What is the main challenge penguins face when trying to fly?"),
])
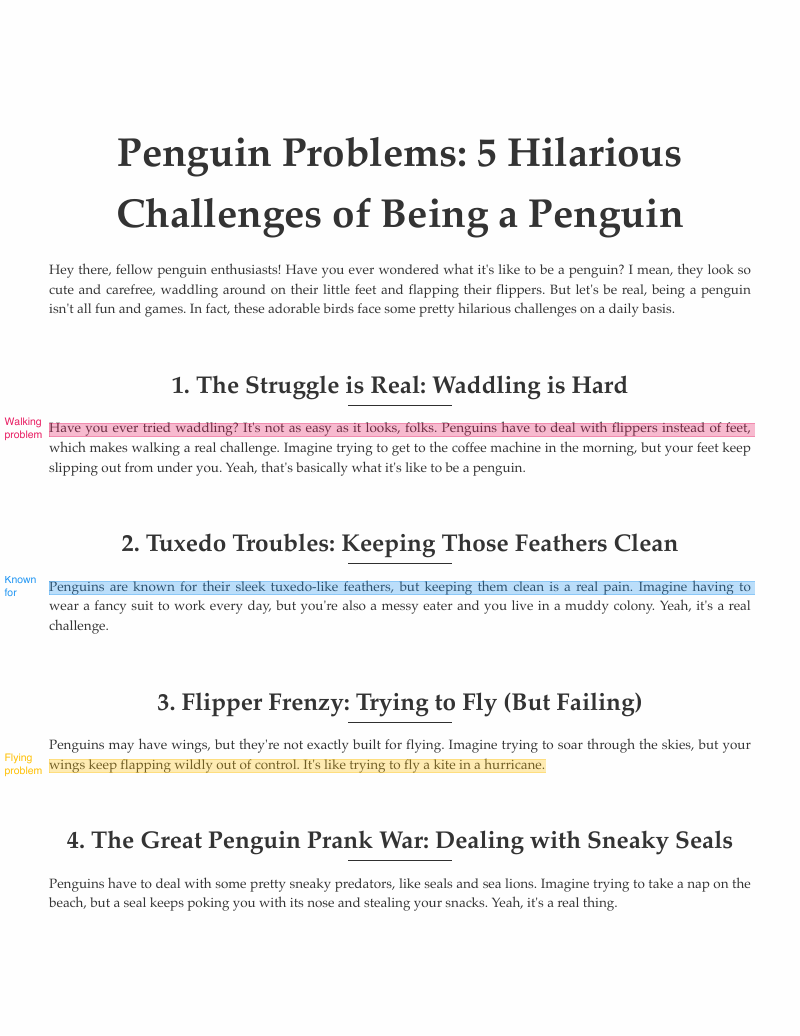
This code highlights the answers to the questions in the PDF file “The Fascinating World of Penguins.pdf” and display the output as an image.
7.7.11. Comparing Python Command Line Interface Tools: Argparse, Click, and Typer#
Python has several tools for creating CLIs, each with its own approach and syntax. Three popular choices for parsing command-line arguments and options are argparse, click, and typer.
argparse: Requires manual argument parsing setup with verbose syntax.
click: Offers a more concise and declarative way to define commands with decorators.
typer: Utilizes Python type hints to create a clean and modern CLI interface with minimal boilerplate.
Here’s a comparison of how to create a simple CLI application with a single command that accepts a string argument using argparse, click, and typer.
argparse:
%%writefile argparse_example.py
import argparse

def main(message):
    print(f"Message: {message}")

if __name__ == "__main__":
    parser = argparse.ArgumentParser(description="A simple CLI with argparse")
    parser.add_argument("message", type=str, help="The message to print")
    args = parser.parse_args()
    main(args.message)
Writing argparse_example.py
python argparse_example.py "Hello, World!"
Message: Hello, World!
click:
%%writefile click_example.py
import click

@click.command()
@click.argument("message")
def main(message):
    print(f"Message: {message}")

if __name__ == "__main__":
    main()
Writing click_example.py
python click_example.py "Hello, World!"
Message: Hello, World!
typer:
%%writefile typer_example.py
import typer

def main(message: str):
    print(f"Message: {message}")

if __name__ == "__main__":
    typer.run(main)
Writing typer_example.py
python typer_example.py "Hello, World!"
Message: Hello, World!
!pip install snoop
%load_ext snoop
%%snoop
import snoop


@snoop
def factorial(x: int):
    if x == 1:
        return 1
    else:
        return x * factorial(x - 1)


if __name__ == "__main__":
    num = 2
    print(f"The factorial of {num} is {factorial(num)}")
11:33:04.31 >>> Call to <module> in File "/var/folders/5w/fg65_rp17lz39z89p0nkv8ch0000gn/T/ipykernel_23035/2084541889.py", line 0
11:33:04.31 ...... __name__ = '__main__'
11:33:04.31    0 |     print(f"The factorial of {num} is {factorial(num)}")
11:33:04.31    1 | import snoop
11:33:04.31 ...... snoop = <class 'snoop.configuration.Config.__init__.<locals>.ConfiguredTracer'>
11:33:04.31    4 | @snoop
11:33:04.31    5 | def factorial(x: int):
11:33:04.31    4 | @snoop
11:33:04.31    5 | def factorial(x: int):
11:33:04.31 ...... factorial = <function factorial at 0x109d1c860>
11:33:04.31   12 | if __name__ == "__main__":
11:33:04.32   13 |     num = 2
11:33:04.32   14 |     print(f"The factorial of {num} is {factorial(num)}")
    11:33:04.32 >>> Call to factorial in File "/var/folders/5w/fg65_rp17lz39z89p0nkv8ch0000gn/T/ipykernel_23035/2084541889.py", line 5
    11:33:04.32 ...... x = 2
    11:33:04.32    5 | def factorial(x: int):
    11:33:04.32    6 |     if x == 1:
    11:33:04.32    9 |         return x * factorial(x - 1)
        11:33:04.32 >>> Call to factorial in File "/var/folders/5w/fg65_rp17lz39z89p0nkv8ch0000gn/T/ipykernel_23035/2084541889.py", line 5
        11:33:04.32 ...... x = 1
        11:33:04.32    5 | def factorial(x: int):
        11:33:04.32    6 |     if x == 1:
        11:33:04.32    7 |         return 1
        11:33:04.32 <<< Return value from factorial: 1
    11:33:04.32    9 |         return x * factorial(x - 1)
    11:33:04.32 <<< Return value from factorial: 2
11:33:04.32   14 |     print(f"The factorial of {num} is {factorial(num)}")
11:33:04.32 <<< Return value from <module>: None
The factorial of 2 is 2
7.7.12. Dynamic Report Generation with Jinja Templates#
F-strings are convenient for simple string interpolation, but they are tightly coupled with the surrounding Python code. They are typically used for a single, specific task.
metrics = {
    'accuracy': 0.95,
    'precision': 0.88,
    'recall': 0.92,
    'f1_score': 0.89,
    'auc_roc': 0.93,
    'specificity': 0.87
}

metrics_str = ""
for metric, value in metrics.items():
    if value > 0.9:
        metrics_str += f"{metric}: {value:.3f} (Excellent)\n"
    else:
        metrics_str += f"{metric}: {value:.3f} (Needs Improvement)\n"

print(metrics_str)
accuracy: 0.950 (Excellent)
precision: 0.880 (Needs Improvement)
recall: 0.920 (Excellent)
f1_score: 0.890 (Needs Improvement)
auc_roc: 0.930 (Excellent)
specificity: 0.870 (Needs Improvement)
Jinja’s templating engine is more versatile and powerful. It allows you to define templates with placeholders for dynamic data and supports conditionals, loops, and reuse across multiple contexts.
Use Jinja to perform complex templating tasks or generate dynamic reports.
## Jinja template version
from jinja2 import Template
template = Template("""
{% for metric, value in metrics.items() %}
    {% if value > 0.9 %}
    {{ metric }}: {{ value | round(3) }} (Excellent)
    {% else %}
    {{ metric }}: {{ value | round(3) }} (Needs Improvement)
    {% endif %}
{% endfor %}
""")

result = template.render(metrics=metrics)
print(result)
    accuracy: 0.95 (Excellent)


    precision: 0.88 (Needs Improvement)


    recall: 0.92 (Excellent)


    f1_score: 0.89 (Needs Improvement)


    auc_roc: 0.93 (Excellent)


    specificity: 0.87 (Needs Improvement)