Manage Data
This section covers some tools to work with your data.
DVC: A Data Version Control Tool for Your Data Science Projects
!pip install dvc
Git is a powerful tool to go back and forth different versions of your code. Is there a way that you can also control different versions of your data?
That is when DVC comes in handy. With DVC, you can keep the information about different versions of your data in Git while storing your original data somewhere else.
It is essentially like Git but is used for data. The code below shows how to use DVC.
# Initialize
$ dvc init

# Track data directory
$ dvc add data # Create data.dvc
$ git add data.dvc
$ git commit -m "add data"

# Store the data remotely
$ dvc remote add -d remote gdrive://lynNBbT-4J0ida0eKYQqZZbC93juUUUbVH

# Push the data to remote storage
$ dvc push

# Get the data
$ dvc pull

# Switch between different version
$ git checkout HEAD^1 data.dvc
$ dvc checkout
Find step-by-step instructions on how to use DVC in my article.
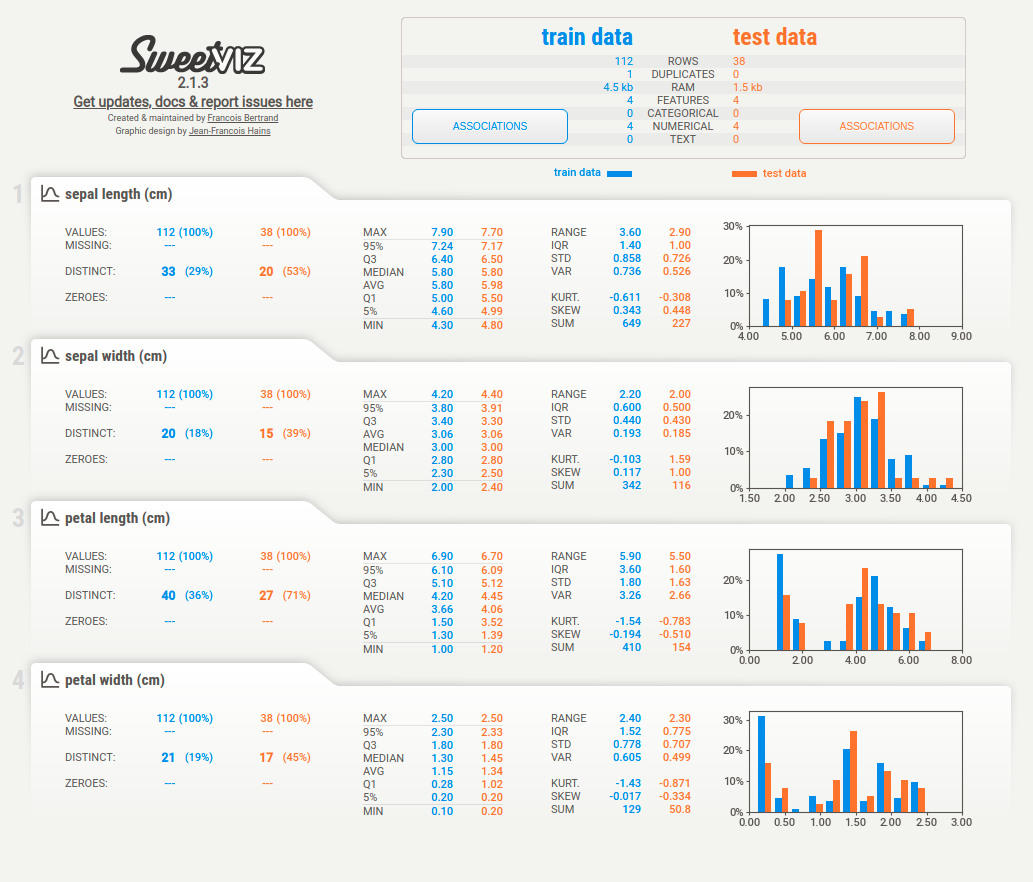
sweetviz: Compare the similar features between 2 different datasets
!pip install sweetviz
Sometimes it is important to compare the similar features between 2 different datasets side by side such as comparing train and test sets. If you want to quickly compare 2 datasets through graphs, check out sweetviz.
from sklearn.datasets import load_iris
from sklearn.model_selection import train_test_split
import sweetviz as sv

X, y = load_iris(return_X_y=True, as_frame=True)
X_train, X_test, y_train, y_test = train_test_split(X, y)

report = sv.compare([X_train, "train data"], [X_test, "test data"])
report.show_html()
Report SWEETVIZ_REPORT.html was generated! NOTEBOOK/COLAB USERS: the web browser MAY not pop up, regardless, the report IS saved in your notebook/colab files.
Opening in existing browser session.
Run the code above and you will generate a report similar to this: